Posted: February 26, 2021
Why do we track changes in land use?
As water flows across the land of our watershed, and through the streams and tributaries of the river, it acts differently depending on how humans use the land. Creating detailed maps of how land use in our region changes over time can be an invaluable tool in understanding the health of our watershed.
Moving down the Ottawa River from Lac des Outaouais, through Lake Timiskaming and all the way to Montréal, you will see various types of land near the shores. Starting in the headwaters, also known as the source of a river, you are surrounded by old forest and sporadic wetlands. As you follow the river through smaller settlements such as Ville-Marie and Mattawa , you encounter some roads, houses and agriculture, but still vast swaths of forest. As you approach the National Capital Region and enter the mouth of the Ottawa River at the Carillon dam, you begin to see a higher density of urban settlements, developed shorelines, and more agricultural lands.
What you are witnessing are several types of land use. The water that enters and flows through our watershed interacts differently with each of these, and it is therefore key to track when and where it changes.

Why is it important to track change?
Monitoring land use change is crucial; Change in Land Use is actually one of the 14 indicators that contribute to the Watershed Health Assessment and Monitoring (WHAM) initiative. It is interconnected with many of the other indicators, including water temperature and riparian connectivity. Did you know that changes to land use around waterways can drastically change their temperature? For example, if vegetation that shades a stream is removed for a new housing development, the maximum summer temperature that the water reaches will be much higher.
Creating an up-to-date, high resolution land classification map of the watershed is the first step in understanding how changes to land use impact stream temperatures. Later this spring, together with a group of dedicated volunteers, Ottawa Riverkeeper will be distributing water temperature loggers at stream and river locations throughout the watershed. In combination with the land use classification, we will be able to learn what the effects of different land use types are having on our stream temperatures.
What is currently available and why shouldn’t we use it?
Current publicly available land use classification maps are typically incomplete, or they have an inappropriate spatial and thematic resolution than what would be needed at the watershed scale (see below). Most are made with a specific purpose in mind, like differentiating crop types or tracking forestry practices. While other available maps may have elements of what exists in the Ottawa River watershed, they do not fully encompass what we want to track within it.
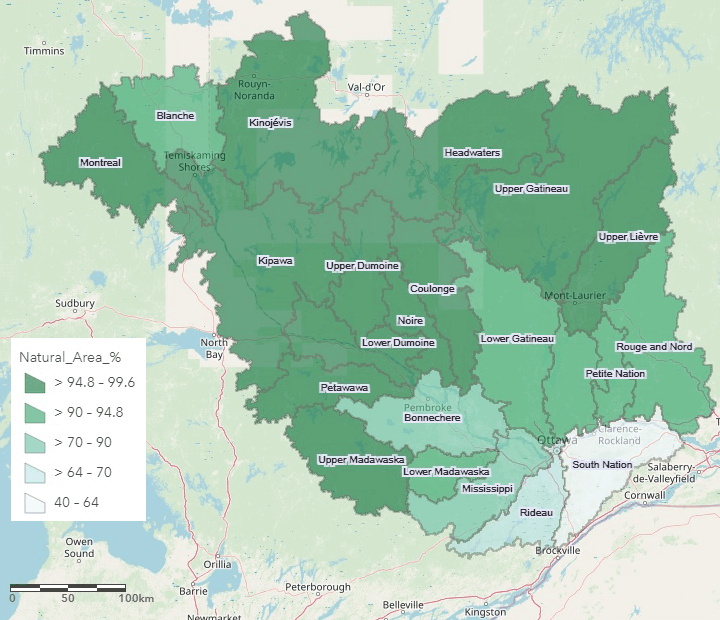
Natural Area Cover % by subwatershed
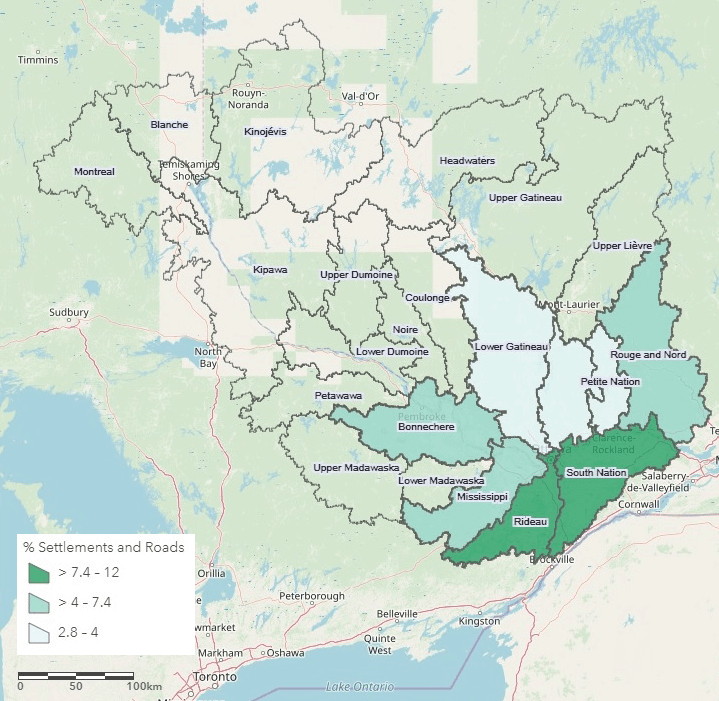
Settlements and Roads % by subwatershed
What are spatial and thematic resolution?
Spatial resolution refers to the area that a pixel on a digital map would cover on the ground. For example, a 30 metre spatial resolution means each pixel covers a 30 metres x 30 metres area on the ground. While this may work for a Canada-wide scale, a much smaller resolution, such as 5 to 10 metres, is necessary for tracking changes to land use in the watershed. Larger resolutions result in a loss of important information, including smaller details like narrow streams or small patches of vegetation.
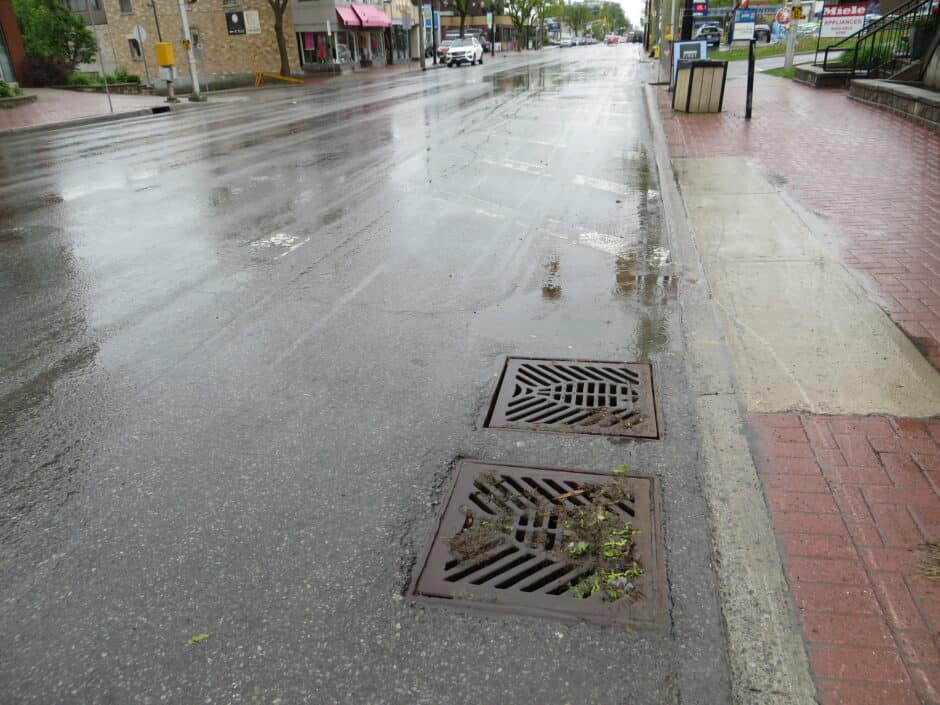
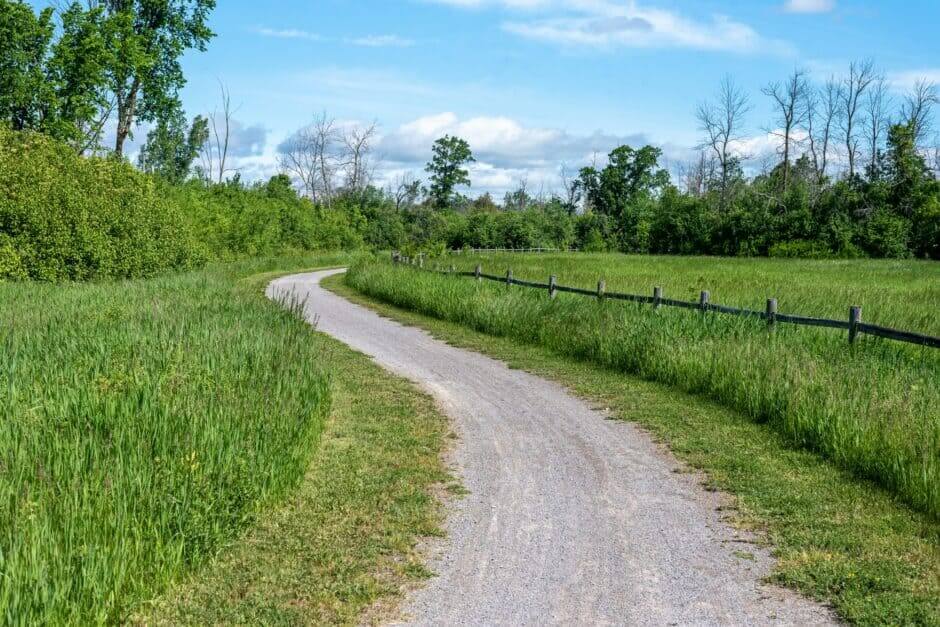
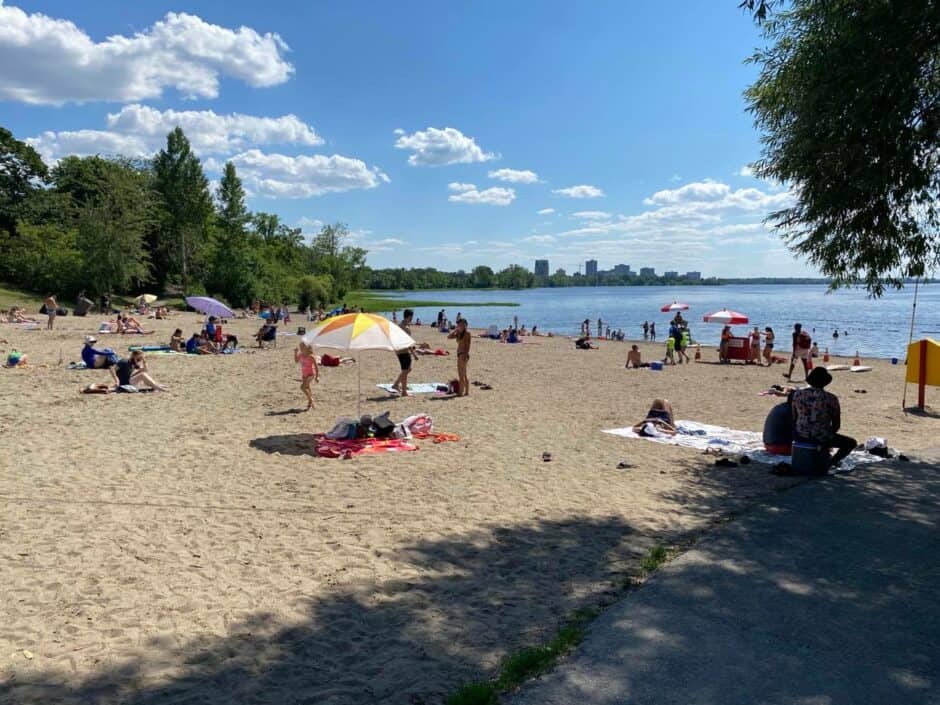
Thematic resolution refers to the number of land use classes that are included in a map. A map can be as simple as 2 classes like land vs. water. Conversely, it can be very complex with almost 100 classes, such as agricultural maps that show each crop type. At Ottawa Riverkeeper, we want to show the classes that are of interest to our watershed and what we see everyday. An array of these will be necessary to determine their impacts on stream temperature. For instance, water, different types of wetland, agricultural land, meadow or fallowed land, several categories of forest and urban or industrial land, including roads.
However, land use change is not completely negative; in fact, it can also be beneficial. For example, when land use around rivers returns to a more natural riparian ecosystem with abundant vegetation, stream temperatures can drop back down to a lower and healthier range. Updating these land use maps every few years will allow us to see which areas have changed and what class they have changed to. If we can show both the negative and positive impacts of certain types of land use changes, we can more effectively push for better land management practices throughout our watershed.
How you can get involved:
Creating a land use map for a watershed as big as ours is an enormous task and we need your help to verify the accuracy of land use maps. All it takes is photographing a land use in your area of the watershed. Head over to the Land Use Monitoring Project webpage for more information and to submit your observations.
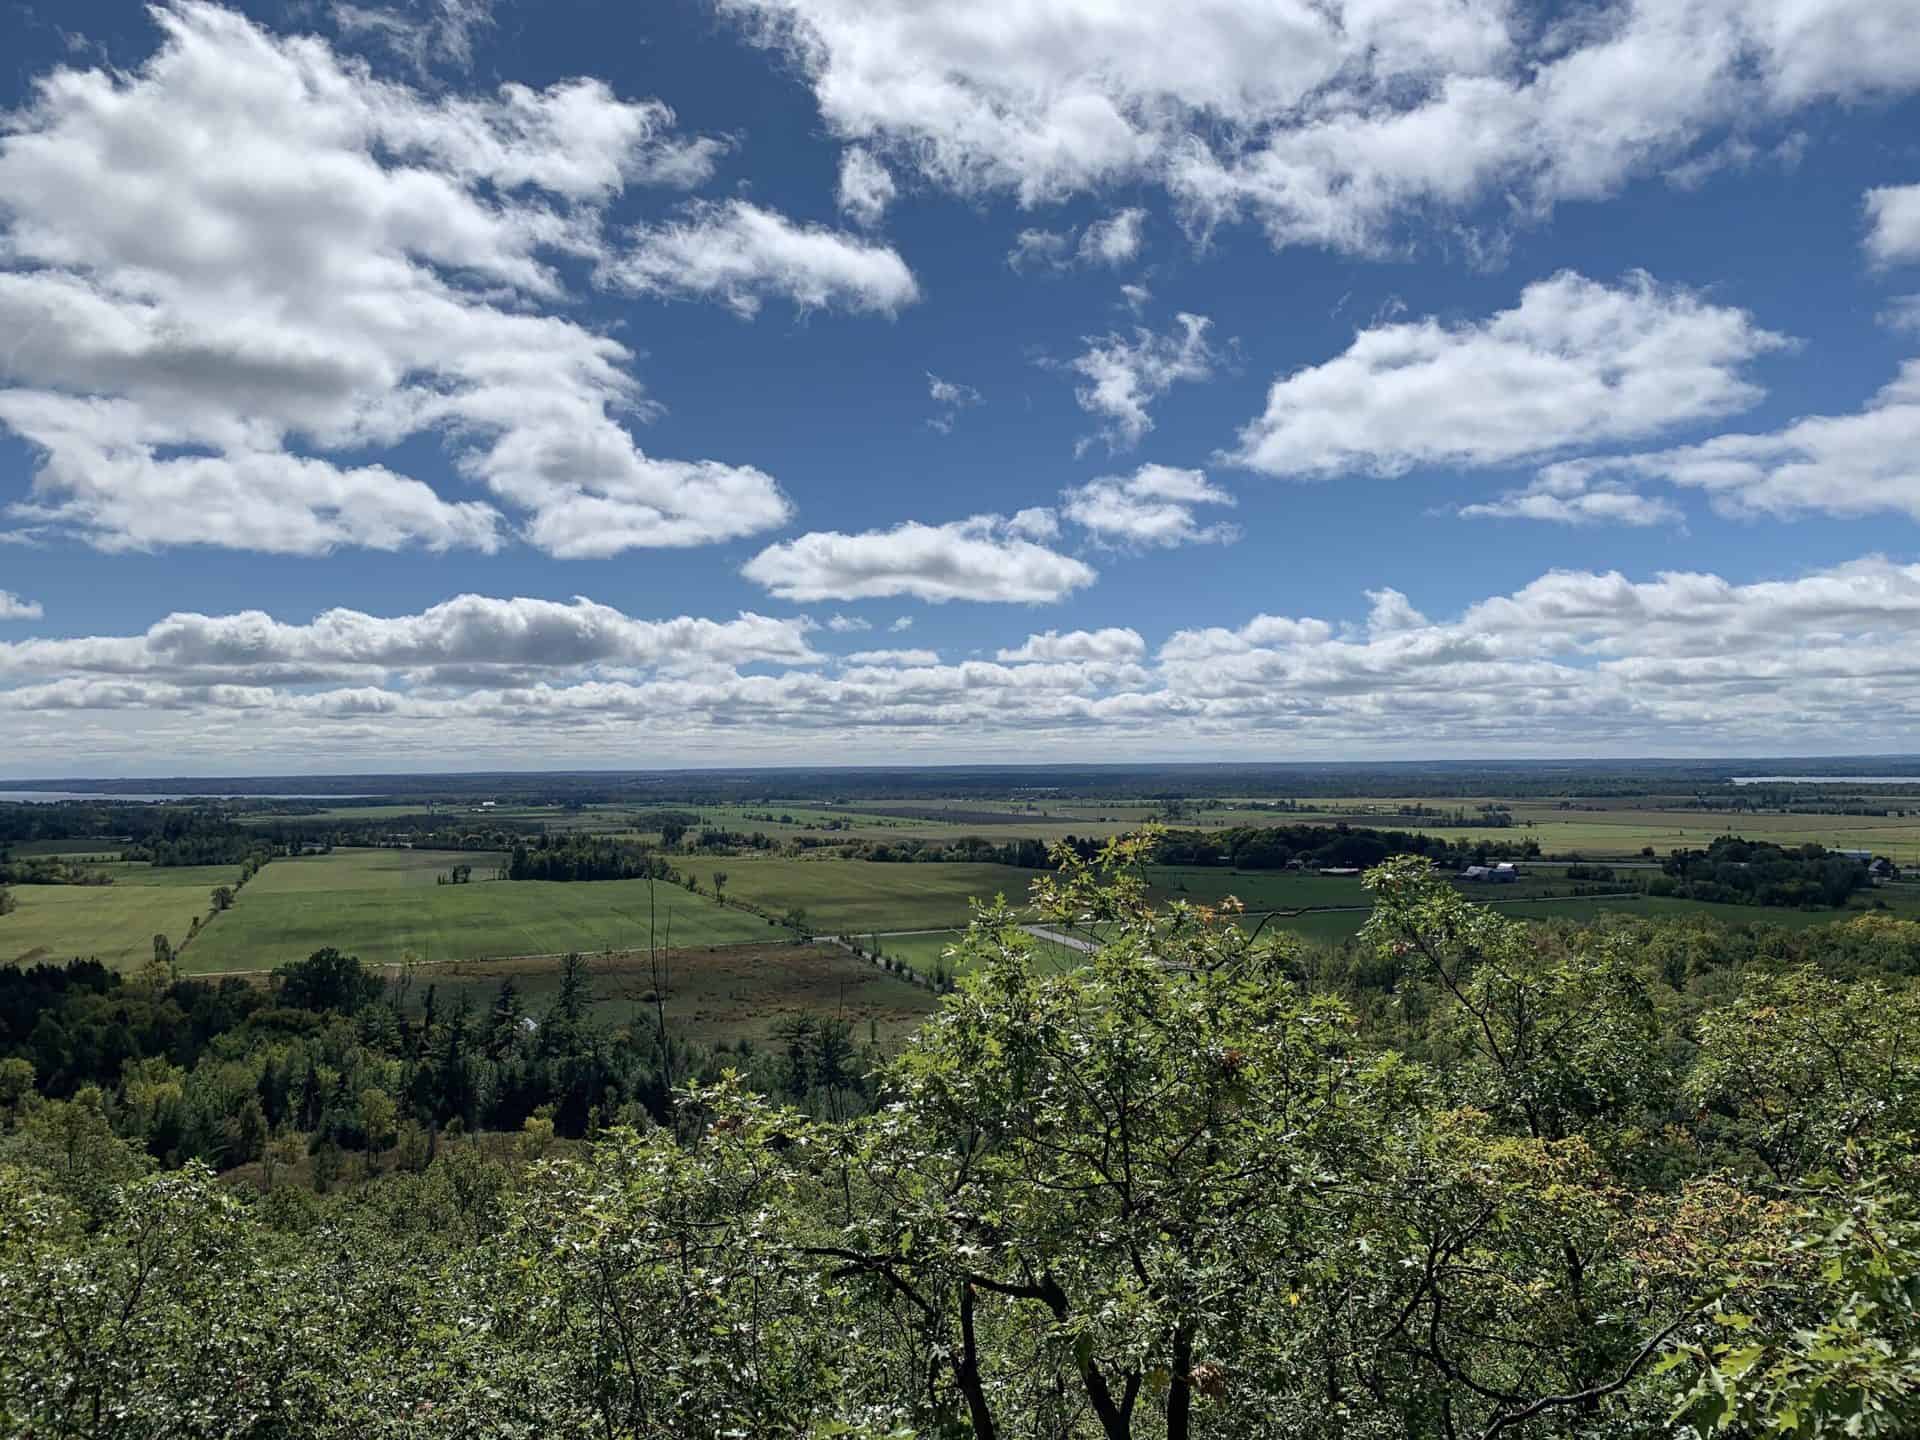
Example submission:
Examples of a land use image and the location it was taken.
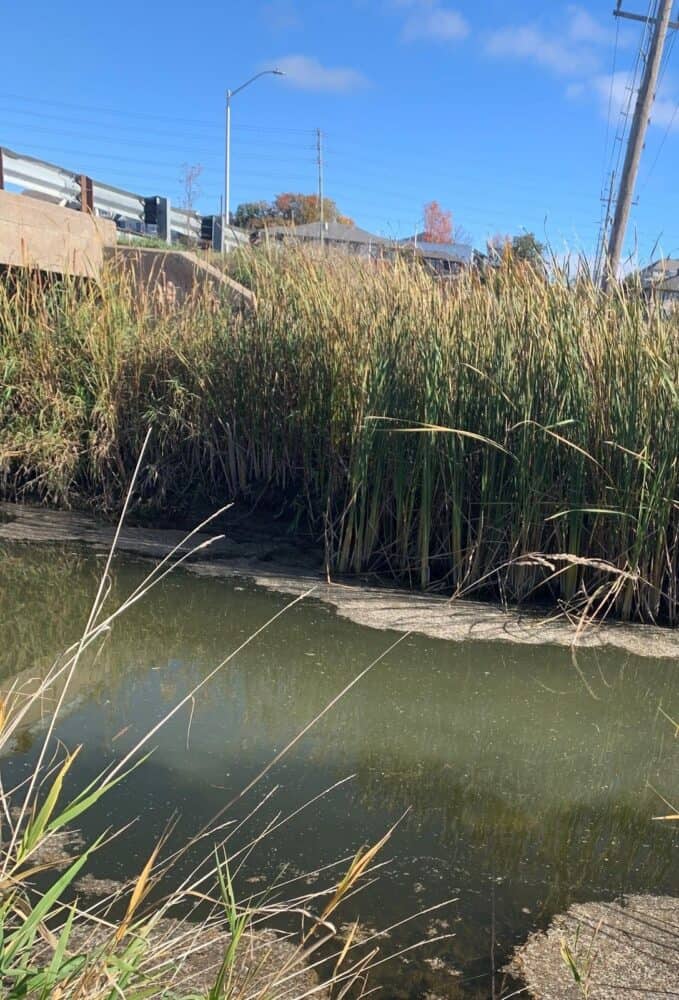

Direction facing when photo was taken: North East
Land use type:
Water – 25%
Wetland – 75%
Comments: It is near the intersection of Richardson Side Rd and Terry Fox Dr, beside the Carp River on the immediate SE side of Richardson Side Rd.