Water Mercury

Project main page || Data || Relationships || Further resources
Introduction:
Mercury is a highly toxic element, and although it can be naturally occurring in aquatic environments, natural concentrations are typically very low and can be completely sequestered from the water column by sediment and vegetation.
Human activity is the predominant source of excess mercury in aquatic ecosystems. In particular, land use can strongly influence the mercury content in a river. Mining, industrial activities, and deforestation can release mercury bound within terrestrial vegetation and soil, which can enter rivers through runoff and increase erosion, further releasing more mercury stored in sediment. Historically, rivers were used to transport trees for the logging industry, which released mercury sequestered within those trees into the water. Flooding of large reservoirs for power generation can also release mercury from trees and vegetation in the area. Over time, mercury is re-sequestered by sediment and aquatic and shoreline vegetation, and factors related to flow (i.e. water quantity and movement) can also help to determine how concentrated mercury is in a given area of the watershed. Therefore, minimizing the input of new mercury into the water via human activity is a crucial component to managing water mercury in the watershed.
Mercury, in the form of methylmercury, is not only toxic, but it also accumulates in the tissues of aquatic animals and is very difficult to eliminate, so even short-term exposures can have long-term consequences, and older individuals are more likely to have greater buildup of mercury. Furthermore, any mercury present in smaller animals such as benthic invertebrates will be passed on to the larger animals such as fish that consume them. This is called bioaccumulation, and it doesn’t stop when fish leave the water. Since fishing is a popular river activity, and significant food source for some communities, fish mercury levels have important implications for human health.
Though the available data for mercury in the Ottawa River Watershed may be encouraging, with many records falling below detection limits, it is too limited to make strong conclusions or tell a full story. With its relevance for both ecological and human health, mercury, both environmental and within animal tissues, is a very important indicator of watershed health to be monitored.
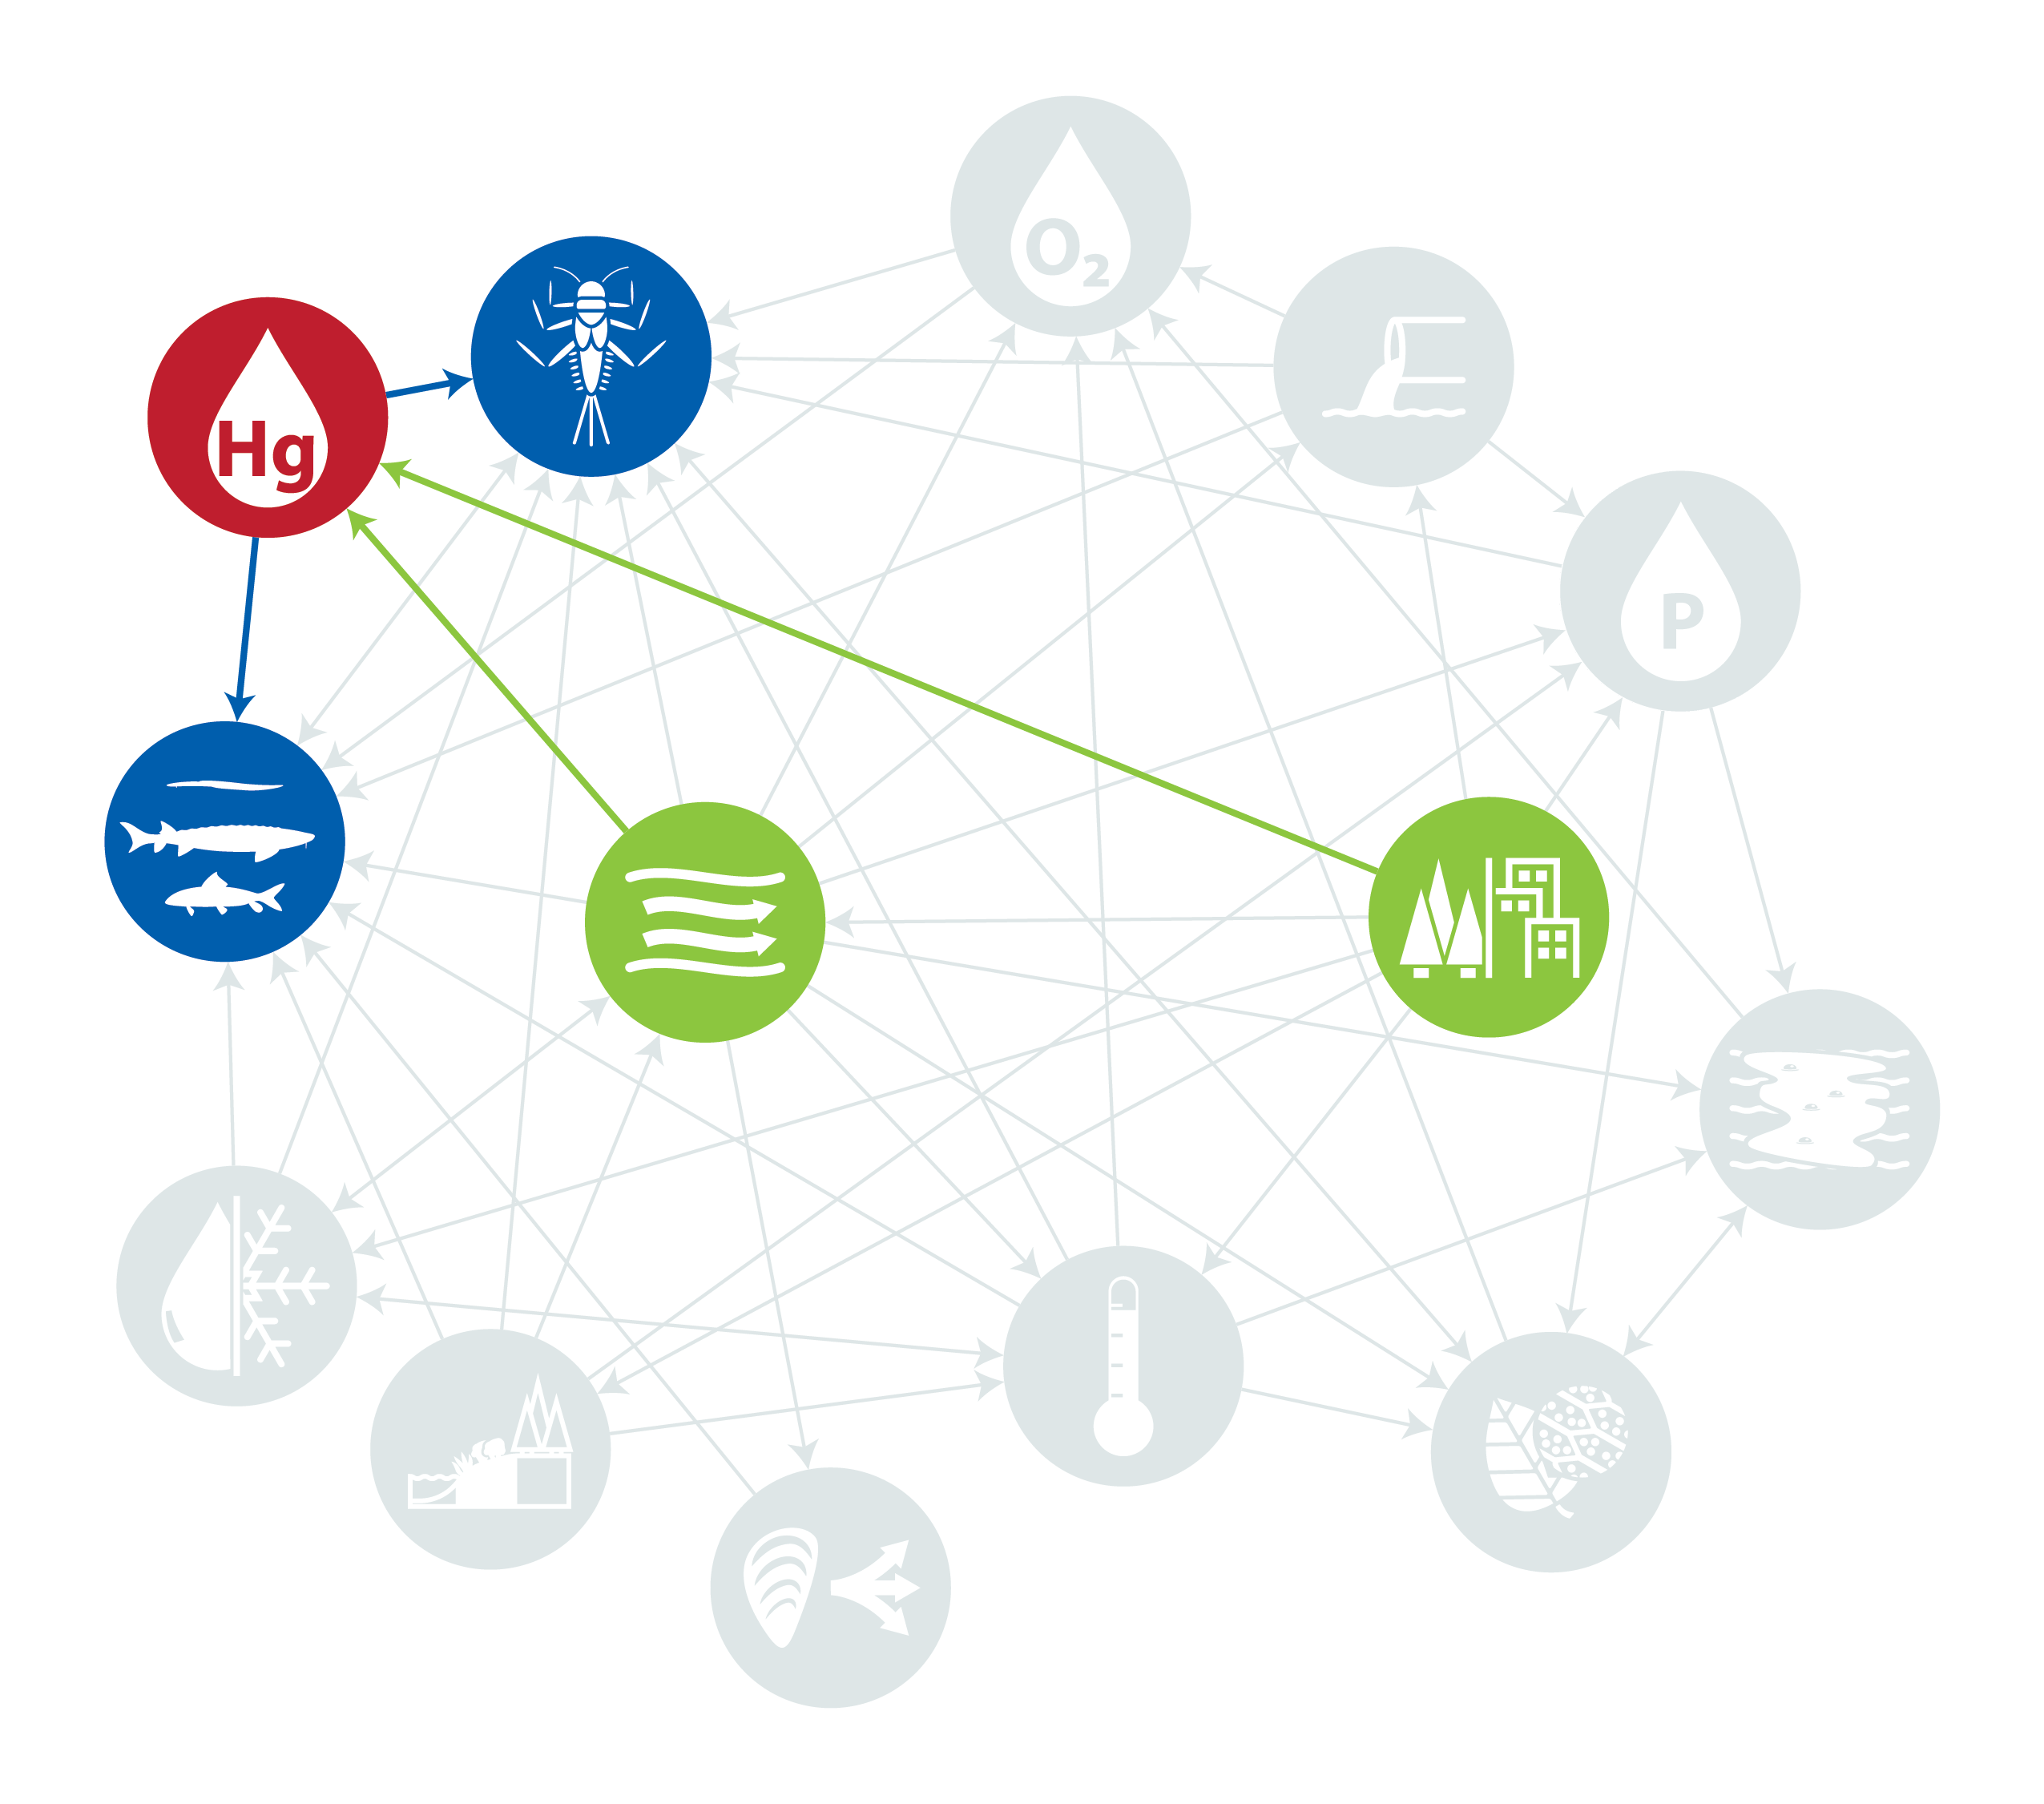
Relationships to other indicators:
Water Mercury
Mercury is highly toxic, but naturally occurring concentrations of it are bound by plants and sediment and removed from the water column. However, human activity introduces excess mercury, resulting in free mercury in the water column. Water mercury is therefore a useful indication of human impact on the watershed.
Algal Blooms
Algae are a group of single-celled and multicellular plant-like organisms. Algal growth contributes and supports the ecosystem in much the same way that plants do, through the production of oxygen and as a potential food source for smaller animals. However, when environmental conditions shift from their normal ranges, this can promote algal blooms, a rapid increase in population size of algae.
Water Temperature
With global temperatures on the rise, water temperature (particularly annual maximum temperatures) will be a crucially important indicator of watershed health moving forward. Water temperature is strongly correlated with a number of other important indicators of ecological status, and can often help to explain, give context to, or even predict changes in habitat quality.
Dissolved Oxygen
Dissolved oxygen (DO) is the concentration of free oxygen in the water column and comes from aquatic plants and algae through photosynthesis, and can also be transferred from the air at the surface of the water. DO is essential for all aquatic life and for the decomposition of organic waste. The amount of available oxygen in the water column is also affected by several abiotic factors including temperature, salinity, pressure and depth, wind, flow, and wave action.
Chlorophyll-a
Chlorophyll-a is used in oxygenic photosynthesis and is the predominant form of chlorophyll in green plants and algae. Measuring the presence of chlorophyll-a in an aquatic environment allows for a better understanding of the density and prevalence of algae which can have an impact on the concentration of dissolved oxygen or likeliness of algal blooms.
Total Phosphorus
Phosphorus is a fundamental building block of life. It has key structural roles in genetic material (eg. DNA) and cellular membranes, and is an active component of cellular energy production, storage, and transfer, meaning many necessary biochemical processes that all living organisms rely on (such as respiration, and nutrient absorption) can only happen if phosphorus is available.
Riparian Connectivity
Natural, vegetated riparian areas, the unique, transitional space between aquatic and terrestrial ecosystems, provide numerous benefits including nearshore habitat, filtering runoff, moderating local temperatures, and stabilizing shorelines. Measuring riparian connectivity can provide important information on the health of a watershed and a better understanding of the resilience to threats these areas have compared to shorelines that have been developed.
Combined Sewer Overflows
Everytime there is a Combined Sewer Overflow, sewage, along with stormwater is released into a waterbody introducing pollutants, pathogens and excess organic waste. Untreated or inadequately treated sewage poses health risks for people who use the water for recreational activities, such as swimming, paddling, etc. It also impacts aquatic ecosystems as the presence of organic matter, and its decomposition, decreases the amount of dissolved oxygen available.
Flow
How much water or volume of water present at a given time and how quickly it moves along the length of the river determines flow. Flow can provide context to a number of other indicators and as an important measure to factor when examining water chemistry or understanding impact of pollutants (for example, the same concentration of pollution will impact a river with low flow differently than one with high flow). Comparing flow within the same reach can help identify different trends and, when affected by barriers, can impact aquatic biota.
Change in Land Use
Land use is a classification for all the various ways an area of land be used and includes agriculture, urban, roads, natural and harvested forests, wetlands and protected areas. Changes in land use have implications for both the quantity and quality of water introduced to the river through runoff and can help analyse changes in other indicators in proximity to where land use changes have occurred.
Benthic Invertebrates
Benthic invertebrates are the organisms found in soils, rocks and organic materials that make up stream, river, and lake beds. Pollution tolerance varies greatly between different species, so the relative abundances of pollution-sensitive and pollution-tolerant benthic invertebrate species is a good indicator of water quality and ecosystem health.
Invasive Species
Invasive species are non-native species that have been introduced to a habitat and are able to outcompete native species. Invasive species disrupt the established ecosystem which can result in a decrease in habitat quality and health.
Fish Richness
Fish richness is a measure of how many different species of fish are present in an ecosystem or habitat. Generally speaking, higher species richness is better, but some confounding factors include habitat type and the presence of invasive species (which can increase richness while threatening ecosystem health).
Ice On/Off
Ice on is the date when a body of water is fully covered by ice, and ice off is the date when the ice disappears from the water surface. These measurements provide information about several environmental conditions, such as air temperature, water temperature, and flow.
Further resources:
Nothing here yet!