Community Science
Ottawa Riverkeeper relies on incredible community science volunteers to collect vital information from around the watershed.
What is Community Science?
Also known as Citizen Science, Community Science at its simplest involves engaging the public in scientific investigations. This can take multiple forms, from simply asking the public to send in observations, all the way up to in-depth partnerships with scientific institutions or professional researchers to investigate specific questions with the help of volunteers.
Ottawa Riverkeeper has long advocated for additional public participation in scientific inquiries within the watershed, and we advocate for the advantages of community science by pioneering its use in our science work.
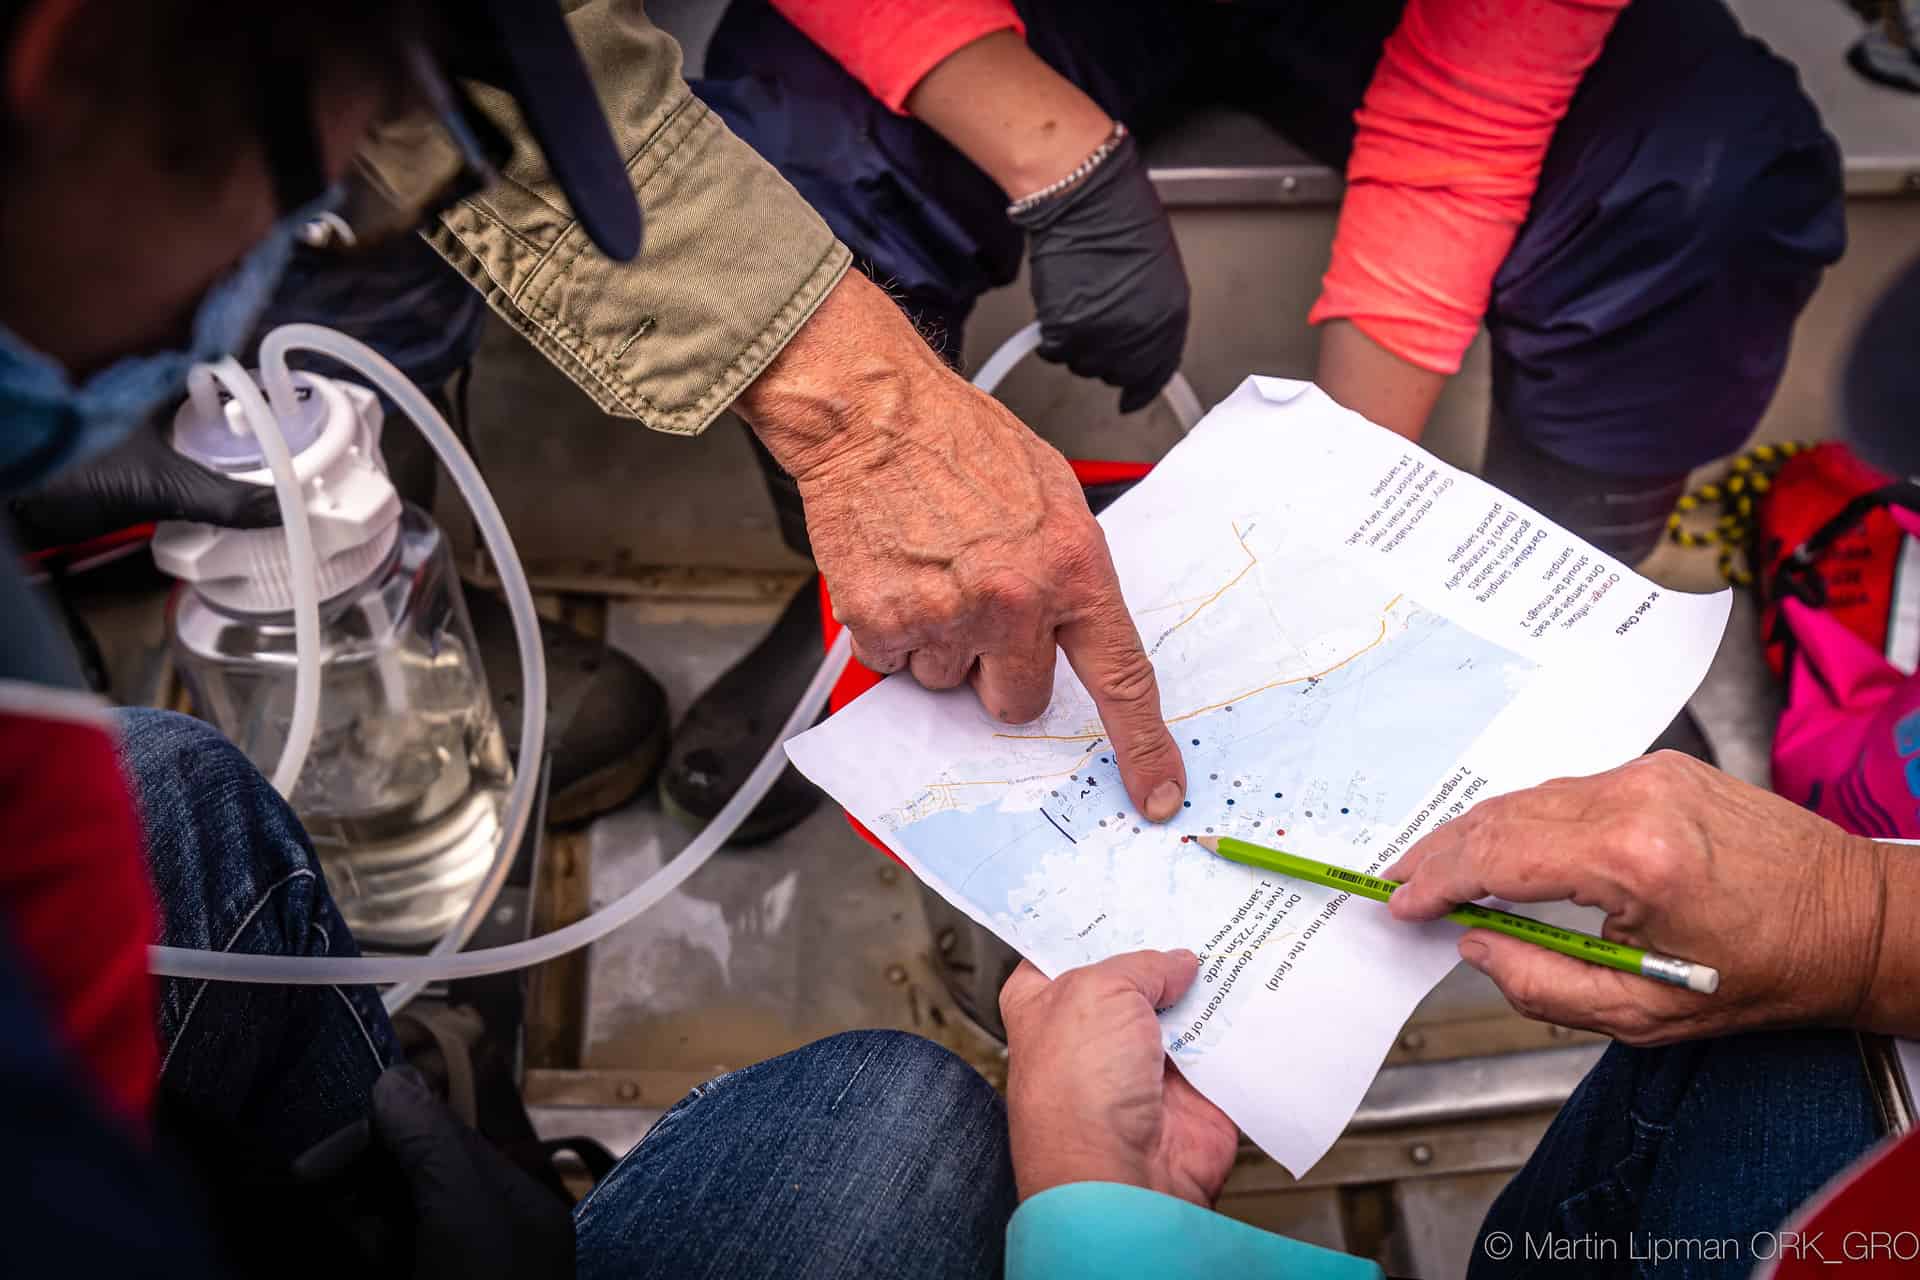
Community-Based Monitoring Initiatives
Ottawa Riverkeeper is currently engaged in several investigations of various aspects of watershed health. Many of these investigations are related to the indicators identified by the Watershed Health Assessment and Monitoring initiative, but others are more specific investigations that rely on volunteers to collect data from a much broader swatch of the watershed than we could investigate on our own.
Click through the other tabs in this table to learn more about each of these programs, what data we are collecting, and how these dedicated volunteers enable us to discover information and monitor risks to our watershed.
Submitting observations and results:
We use an application called ArcGIS Survey 123 to enable Community Scientists to submit their photos, data, and observations. It is available in your browser, or can be downloaded from the Apple and Google app stores.
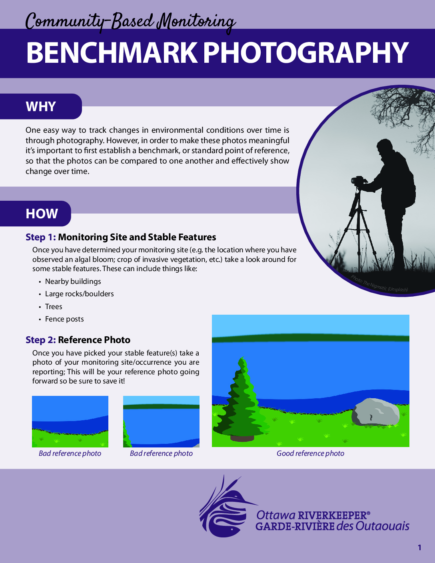
One easy way to track changes in environmental conditions over time is through photography. The technique of benchmark photography is important for many of Ottawa Riverkeeper’s Community Science projects.
Refer to our monitoring guide to learn how to take meaningful images for use in Community-Based Monitoring.
Open Data Portal:
Our open data portal has been created to allow everyone access to a diverse range of information about the Ottawa River watershed. It is a platform designed to facilitate the exploration and discovery of the many reports and data available about the Ottawa River and its tributaries from a wide variety of sources.
The portal remains a work in progress, and will continue to be improved and expanded over time.
The issue:
Algae support and contribute to the ecosystem in much the same way that plants do, through the production of oxygen and as a potential food source for smaller animals. However, when changes to environmental conditions occur, like increases in water temperature, or an excess of nutrients (e.g. from agricultural runoff or sewage outflows), algae are often able to take advantage of these inputs and proliferate. This increase in algae can result in the formation of algal blooms, which can have negative impacts on the ecosystem, including a decrease in dissolved oxygen, and the production of toxins by some species. Algal blooms can also make the water unpleasant or unsafe to be around, limiting people’s ability to access impacted areas.
Monitoring methodology:
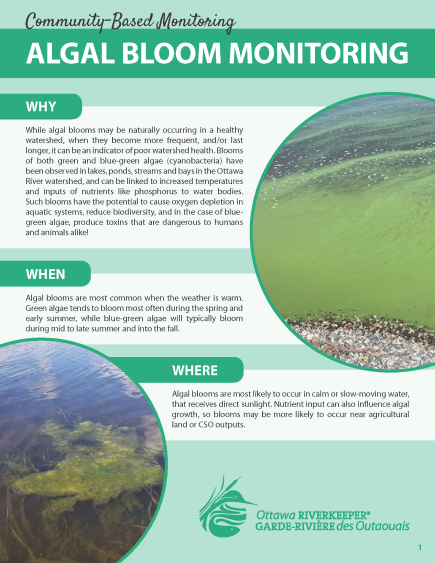
Algal blooms are common within different parts the Ottawa River watershed, but despite our understanding of what can cause algal blooms and in which environments they tend to happen (often areas with low flow such as lakes, bays, and ponds), it is still very difficult to actually predict when or where a bloom will occur. It is therefore very important for us to monitor algal blooms, particularly noting environmental conditions at the time of, and leading up to the appearance of the excess algae so we are better aware of the frequencies and locations of blooms within the watershed.
Refer to our monitoring guide to learn how to differentiate different types of algal bloom, and the information you’ll need to collect to submit an abservation.
Get involved:
Interested in participating in our algal bloom monitoring project? There are two ways you can help us learn more about algae in the watershed:
- reporting a bloom through our Survey 123 monitoring app, or on WaterRangers
- participating in our long-term monitoring initiative.
If you are interested in participating in long-term monitoring please contact CBM@ottawariverkeeper.ca.
Find out more:
Algal Blooms is one of Ottawa Riverkeeper’s 14 indicators of watershed health. Find out more about this indicator here. Data from this monitoring project is available here on Ottawa Riverkeeper’s Open Data Portal.
The issue:
Invasive species are plants or animals that do not belong where humans have intentionally, unintentionally, or accidentally introduced them. The effects and impacts of invasive species on the environment can vary. While some may be able to fill ecological niches that were previously unoccupied by native species, resulting in minimal impacts, others have been known to outcompete native species to such an extent that they deplete resources and completely reshape entire ecosystems.
Invaders can show up in new parts of the watershed without warning and quickly take over a given area. Given the myriad ways in which invasive species can be introduced and spread it can be quite a challenge to track their occurrence. Although some initiatives have been put in place to monitor invasive species, data for the Ottawa River watershed is still limited.
Monitoring methodology:
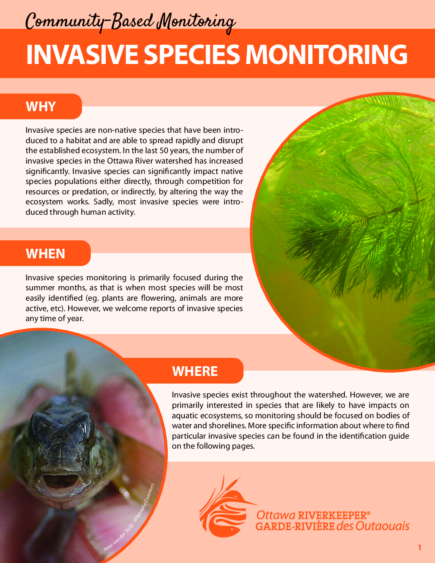
Invasive species are an indicator of watershed health that can easily be tracked by Citizen Scientists. Our Invasive Species Community Based Monitoring project is an open call for sightings of invasive species known to occur in, or to be encroaching on the Ottawa River watershed. Your submissions to this project will help us better track the occurrence of invasive species throughout the watershed and to monitor their effects on ecosystem health.
Refer to our monitoring guide to learn what species we are looking out for and how volunteers can submit observations.
Get involved:
Participating in our Invasive Species Community Based Monitoring project is as easy as 1-2-3:
- Identified an invasive species? Snap a photo!
- Where did you spot it? Make note of your GPS location
- Submit your observation using our Survey 123 monitoring app or on either WaterRangers or iNaturalist!
If you are interested in participating in long-term monitoring please contact CBM@ottawariverkeeper.ca. We are currently looking for volunteers to help with our Zebra Mussel monitoring project. To participate in this project you will need to have regular access to the water and/or a dock between the months of July and September. If you’re interested in participating, please email with the subject line: “Zebra Mussel Monitoring”.
Find out more:
Invasive Species is one of Ottawa Riverkeeper’s 14 indicators of watershed health. Find out more about this indicator here. Data from this monitoring project is available here on Ottawa Riverkeeper’s Open Data Portal.
The issue:
In short, ice on is the date when a body of water is fully covered by a layer of ice thick enough to stand on, and ice off is the date when that body of water becomes completely free of ice. Timing and duration of ice cover can provide valuable information about the health of the watershed, particularly in the context of climate change, as freeze-thaw cycles are tightly linked to changes in both air and water temperature.
Ice on/ice off cycles also affect sediment and nutrient delivery and serve as important biological cues for some species, with ice on triggering behaviours like hibernation (or hibernation-like behaviours), and ice off signaling the beginning of spawning and/or major foraging seasons.
Unfortunately, data is scarce for ice on/ice off in the Ottawa River Watershed, likely in part due to the fact that it can vary significantly depending on the area of the watershed. Some areas freeze as soon as temperatures drop, others never freeze, and some can even freeze and thaw multiple times in a single winter. With an area larger than England, it’s hard to get the whole story about ice on/off in the watershed without a little help.
Monitoring methodology:
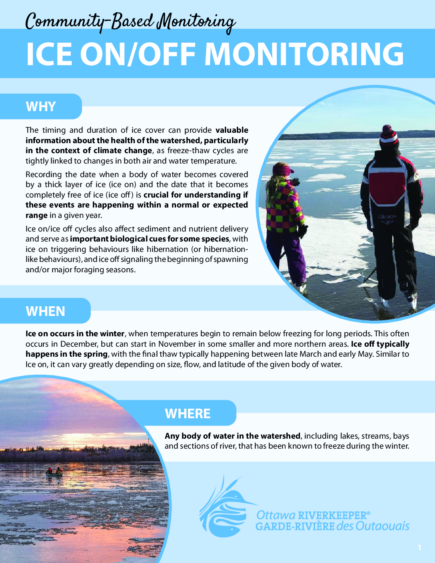
Since the appearance and disappearance of ice on the surface of the water can often be determined by a simple visual observation that does not require special equipment or training, ice on/ice off has the potential to be very well-documented through community science. If you live near water (lake, stream, tributary, or section of the main stem) that has been known to freeze during the winter, we want to hear from you! In the fall/winter when ice forms, and in the spring when it melts, let us know what dates these events occur. For areas that freeze and thaw multiple times before remaining frozen, please report both the first date of ice on conditions and the date those conditions appeared and remained. Similarly, areas that refreeze in the spring after ice off conditions have occurred, please report the dates of the first and final thaws.
Refer to our monitoring guide to learn how to identify both ice on and ice off, and for and how volunteers can submit observations.
Get involved:
You can send observations in through our Survey 123 monitoring app. When submitting an observation, please include the location, GPS coordinates, as well as a picture, and weather conditions for that day if possible. We will add your observations to our map, so you, and the rest of the watershed, can see how ice cover changes over time throughout the watershed.
In addition, we will add your submissions to IceWatch, a national database of ice conditions, whose guidelines we use to set our ice on/off definitions.
If you live near water (lake, stream, tributary, or section of the main stem) that has been known to freeze during the winter, and are interested in participating in long-term monitoring, please contact CBM@ottawariverkeeper.ca.
Find out more:
Ice On/Off is one of Ottawa Riverkeeper’s 14 indicators of watershed health. Find out more about this indicator here. Data from this monitoring project is available here on Ottawa Riverkeeper’s Open Data Portal.
The issue:
Phosphorus is a nutrient that is naturally present in water and is essential for the growth of plants and animals. However, high levels of phosphorus in water can lead to eutrophication, which is the excessive growth of algae and other aquatic plants that can cause a variety of environmental problems, such as decreased oxygen levels, fish kills, and the formation of harmful algal blooms.
Total phosphorus is the measure of all forms of phosphorus present in water, including dissolved, particulate, and organic forms. As a key indicator of water quality, total phosphorus is often used to assess the potential for eutrophication in freshwater systems. Levels of total phosphorus can be affected by various factors such as agricultural runoff, sewage discharge, and stormwater runoff.
Measuring phosphorus and total phosphorus in water is an important tool for understanding water quality, identifying potential sources of pollution and guide management actions to protect water quality in the river.
Monitoring methodology:
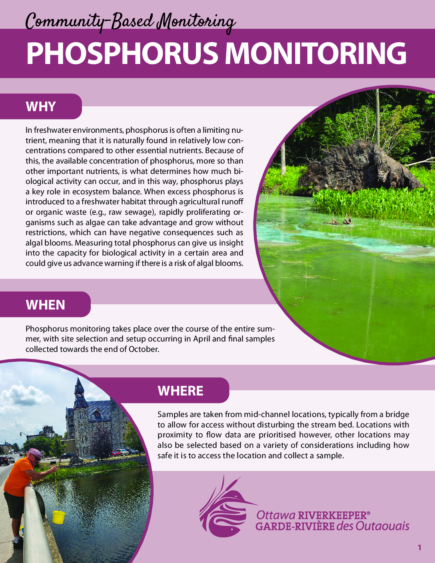
Monitoring total phosphorus in a river involves regularly collecting water samples and analyzing them for total phosphorus concentration. Once the total phosphorus concentration has been measured, it can be compared to regulatory standards or historical data to assess the health of the river ecosystem and identify any potential issues that need to be addressed.
It is important to follow standardized procedures for sampling, transport, and analysis of water samples to ensure accurate and reliable results. Refer to our monitoring guide to learn where, when, and how volunteers monitor for total phosphorus.
Get involved:
If you are interested in participating in long-term monitoring, please contact: CBM@ottawariverkeeper.ca.
Find out more:
Total Phosphorus is one of Ottawa Riverkeeper’s 14 indicators of watershed health. Find out more about this indicator here. Data from this monitoring project is available here on Ottawa Riverkeeper’s Open Data Portal.
The issue:
When road salt, generally in the form of sodium chloride (NaCl), enters an aquatic environment it will dissociate into its ionic forms (Na+ and Cl–). Of these two ions the chloride ion (Cl–) poses the greatest threat to aquatic ecosystems and the organisms that live within them, particularly amphibian, fish and invertebrate species. Once chloride enters the water column it can be quite persistent; it doesn’t biodegrade, nor does it readily absorb onto sediment or other organic surfaces. This can result in chloride concentrations in the stream remaining high long after its initial introduction. Due to its ability to persist once introduced to an aquatic environment, chloride toxicity can be defined as either acute or chronic. Both acute and chronic chloride toxicity can have adverse effects on aquatic organisms.
Acute chloride toxicity refers to a short-term exposure to highly elevated concentrations of chloride, generally coinciding with a one-time influx to an ecosystem.
Chronic chloride toxicity refers to long-term exposure to elevated concentrations of chloride.
Monitoring methodology:
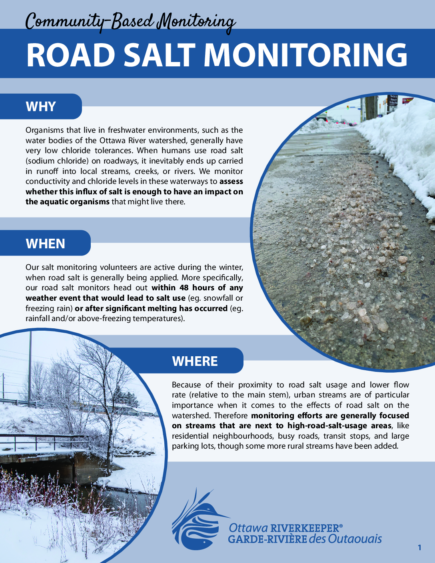
Peak chloride levels tend to occur in the winter as this is when salt is added to roadways and sidewalks. For this reason, Ottawa Riverkeeper volunteers monitor chloride levels during the winter months, in streams that are close to roadways. More specifically, samples are being collected particularly during warming periods, when there is significant snow melt.
Ottawa Riverkeeper uses two methods to determine chloride concentrations. First, water samples are sometimes collected and sent to a partner laboratory to directly measure their chloride concentrations. We also use conductivity, which provides insight to the total dissolved ions in water, as a proxy measurement for chlorides. By comparing laboratory-analyzed chloride concentrations to that water’s conductivity, we can confidently estimate how much chloride is dissolved in other water samples.
Refer to our monitoring guide to learn where, when, and how volunteers monitor for chloride concentrations, using conductivity as a proxy.
Get involved:
If you are interested in participating in long-term monitoring please contact CBM@ottawariverkeeper.ca.
Find out more:
You can learn even more about Ottawa Riverkeeper’s road salt monitoring project by following this link. Data from this monitoring project is available here on Ottawa Riverkeeper’s Open Data Portal.
The issue:
In the summer months, beaches on the river can be closed by the local health department if water quality conditions pose a health risk to swimmers. However, regulations on either side of the river are very different. Additionally, depending on where you are in the Ottawa River watershed the frequency of recreational water quality sampling differs.
Monitoring methodology:
During the summer months, Ottawa Riverkeeper staff and trained volunteers conduct water quality sampling at less frequently monitored beaches and/or popular unmonitored sites.
Water quality samples are collected following provincially set sampling protocols. For beaches located in Ontario, each sample day, five 100 mL-samples are collected at evenly spaced distances within the swim area at the beach. For beaches located in Quebec, samples are collected following the “W” method where the five samples are collected in a W formation in the swim area along the beach.
Following collection, samples are processed and analysed at Ottawa Riverkeeper’s in-house Community Science Lab using IDEXX’s Colilert Test and Quanti Tray/2000 System. It takes a minimum of 24 hours after the sample has been processed before the results can be read. Once available results are posted on Swim Guide where they can be accessed through the website and mobile app.
Get involved:
If you are interested in participating in long-term monitoring please contact CBM@ottawariverkeeper.ca.
Results from our recreational water quality monitoring program are made available to the public on Swim Guide under the Ottawa Riverkeeper Monitoring Sites region. In order to share these results while ensuring that it is clear that Ottawa Riverkeeper does not have authority over any beach, beaches that are monitored by an official authority are further identified with “Community Monitoring Results” in the beach name.
Please note: The authority to open or close a beach remains with the local health department or city. Results posted to Ottawa Riverkeeper Monitoring Site beaches DO NOT dictate whether the beach is open or closed and are provided solely so beachgoers can make informed decisions when deciding to visit a beach.
Find out more:
You can learn even more about Ottawa Riverkeeper’s recreational water quality monitoring project, and how we post the results on Swim Guide, by following this link.