About Ottawa
Riverkeeper
What is a
Watershed?
What does a healthy
watershed look like?
Presenting
Sponsor
About Ottawa
Riverkeeper
Ottawa Riverkeeper, a charitable organisation, is a champion and collective voice for the Ottawa River watershed, providing leadership and inspiration to protect, promote and improve its ecological health and future.
Guided by a science-based approach, we provide clear information with the aim to engage the public and empower citizens and decision-makers, and inspire cooperative action focused toward ensuring clean, healthy, and accessible water for all people and species.
Learn more at ottawariverkeeper.ca!
What is a
Watershed?
A watershed, also known as a catchment or drainage basin, is simply all of the land and waterways that drain towards a single location. Here is another way to think about it: imagine a bathtub. As you add water to the bathtub, no matter where it falls within the bathtub it will eventually flow towards the drain. In a watershed, if water is poured onto the land (such as rainfall), it will eventually flow into a certain body of water (either directly, or via smaller tributaries). That area of land is then part of that body of water’s watershed.
Every body of water has a watershed, and can in turn be part of another watershed. For example, the area of land that drains into the Gatineau River makes up the Gatineau River watershed. The Gatineau River drains into the Ottawa River though, so all that land is also part of the Ottawa River watershed. The Gatineau River watershed is therefore considered a sub-watershed of the Ottawa River watershed. The Ottawa River watershed contains several large subwatersheds, and in turn is itself a subwatershed of the St Lawrence River watershed.
A watershed can have many different types of land cover. Forests, wetlands, waterbodies, cities, towns and other developed areas, and agricultural lands are all examples of land cover. The land cover present in a watershed can have an impact on the rivers within it by changing how quickly rainfall moves over the land. Plus, if there are pollutants, nutrients, or sediment, these might be transported to local streams and impact the river’s water quality. Everything within a watershed is connected; what happens in one area can have big impacts on the others.
What does a healthy
watershed look like?
A healthy watershed is one where humans and nature live in balance. That means native species thrive, and their habitat remains intact, even alongside human habitation.
There are many interconnected factors that influence the ecological health of a river and its watershed. For example, for every watershed there will be normal, healthy ranges of water temperatures, flow volumes and rates, nutrient concentrations, as well as populations of native species. If conditions shift outside of their healthy ranges, or if there is pollution or the introduction of new species, that balance can be disrupted and change the health of the watershed. However, in a system as large and complex as the Ottawa River watershed, there is so much natural variation geographically, temporally, and seasonally, that determining whether the watershed as a whole is healthy or not is a difficult puzzle to solve. If there is pollution in the lower half of the river, but the areas upstream are still clean, is the whole watershed unhealthy? Does the presence of an invasive species in one area change the entire watershed as a whole? The answers to these questions, unfortunately, are not straightforward, but if we can detect and address issues quickly, we can protect other areas. By doing this, we can improve the overall health of the watershed.
This is why Ottawa Riverkeeper is working on a Watershed Health Assessment and Monitoring project. By working with experts, academic researchers, Algonquin communities, and volunteer citizen scientists, this ongoing project aims to collect and analyse data, and share what we learn with you as well as decision-makers. The data collection is focused on 14 indicators of aquatic ecosystem health, and collected throughout the watershed. By working together with lots of different groups and people, and by creating accessible educational tools like this discovery portal, we hope to inspire and empower citizens of the watershed to learn more about the health of the watershed and take actions to protect the incredible Ottawa River.
Presenting
Sponsor
Ottawa Riverkeeper’s Discovery Portal is presented by RBC.
Ottawa Riverkeeper would like to thank the generous support of RBC for making the Discovery Portal possible.
Additional funding for the Watershed Health Assessment and Monitoring initiative comes from:

Visit our website for more information about our partners and funding.
With increased urbanization, industry, and development, how has the watershed changed?
Landscapes have a strong relationship with the rivers that pass through them. Slope, geology, and vegetation all influence how rainfall and snowmelt moves over the land towards the rivers. If this water is slowed or held back by soils, mosses, wetland, vegetation or gentle slopes it allows water to be absorbed into the soil. This also means that underground reservoirs, or aquifers, are refilled with groundwater.
Development – building roads, buildings, and other human structures – changes how landscapes and rivers interact. They smooth out the surface so that water moves too fast to be absorbed into the soil. In a developed landscape, water flows across the ground quickly when it rains or the snow melts, and the sediment and pollutants get carried with it, often arriving in streams through sewers all at once.
Mapping Urbanisation and Land Use in the Watershed
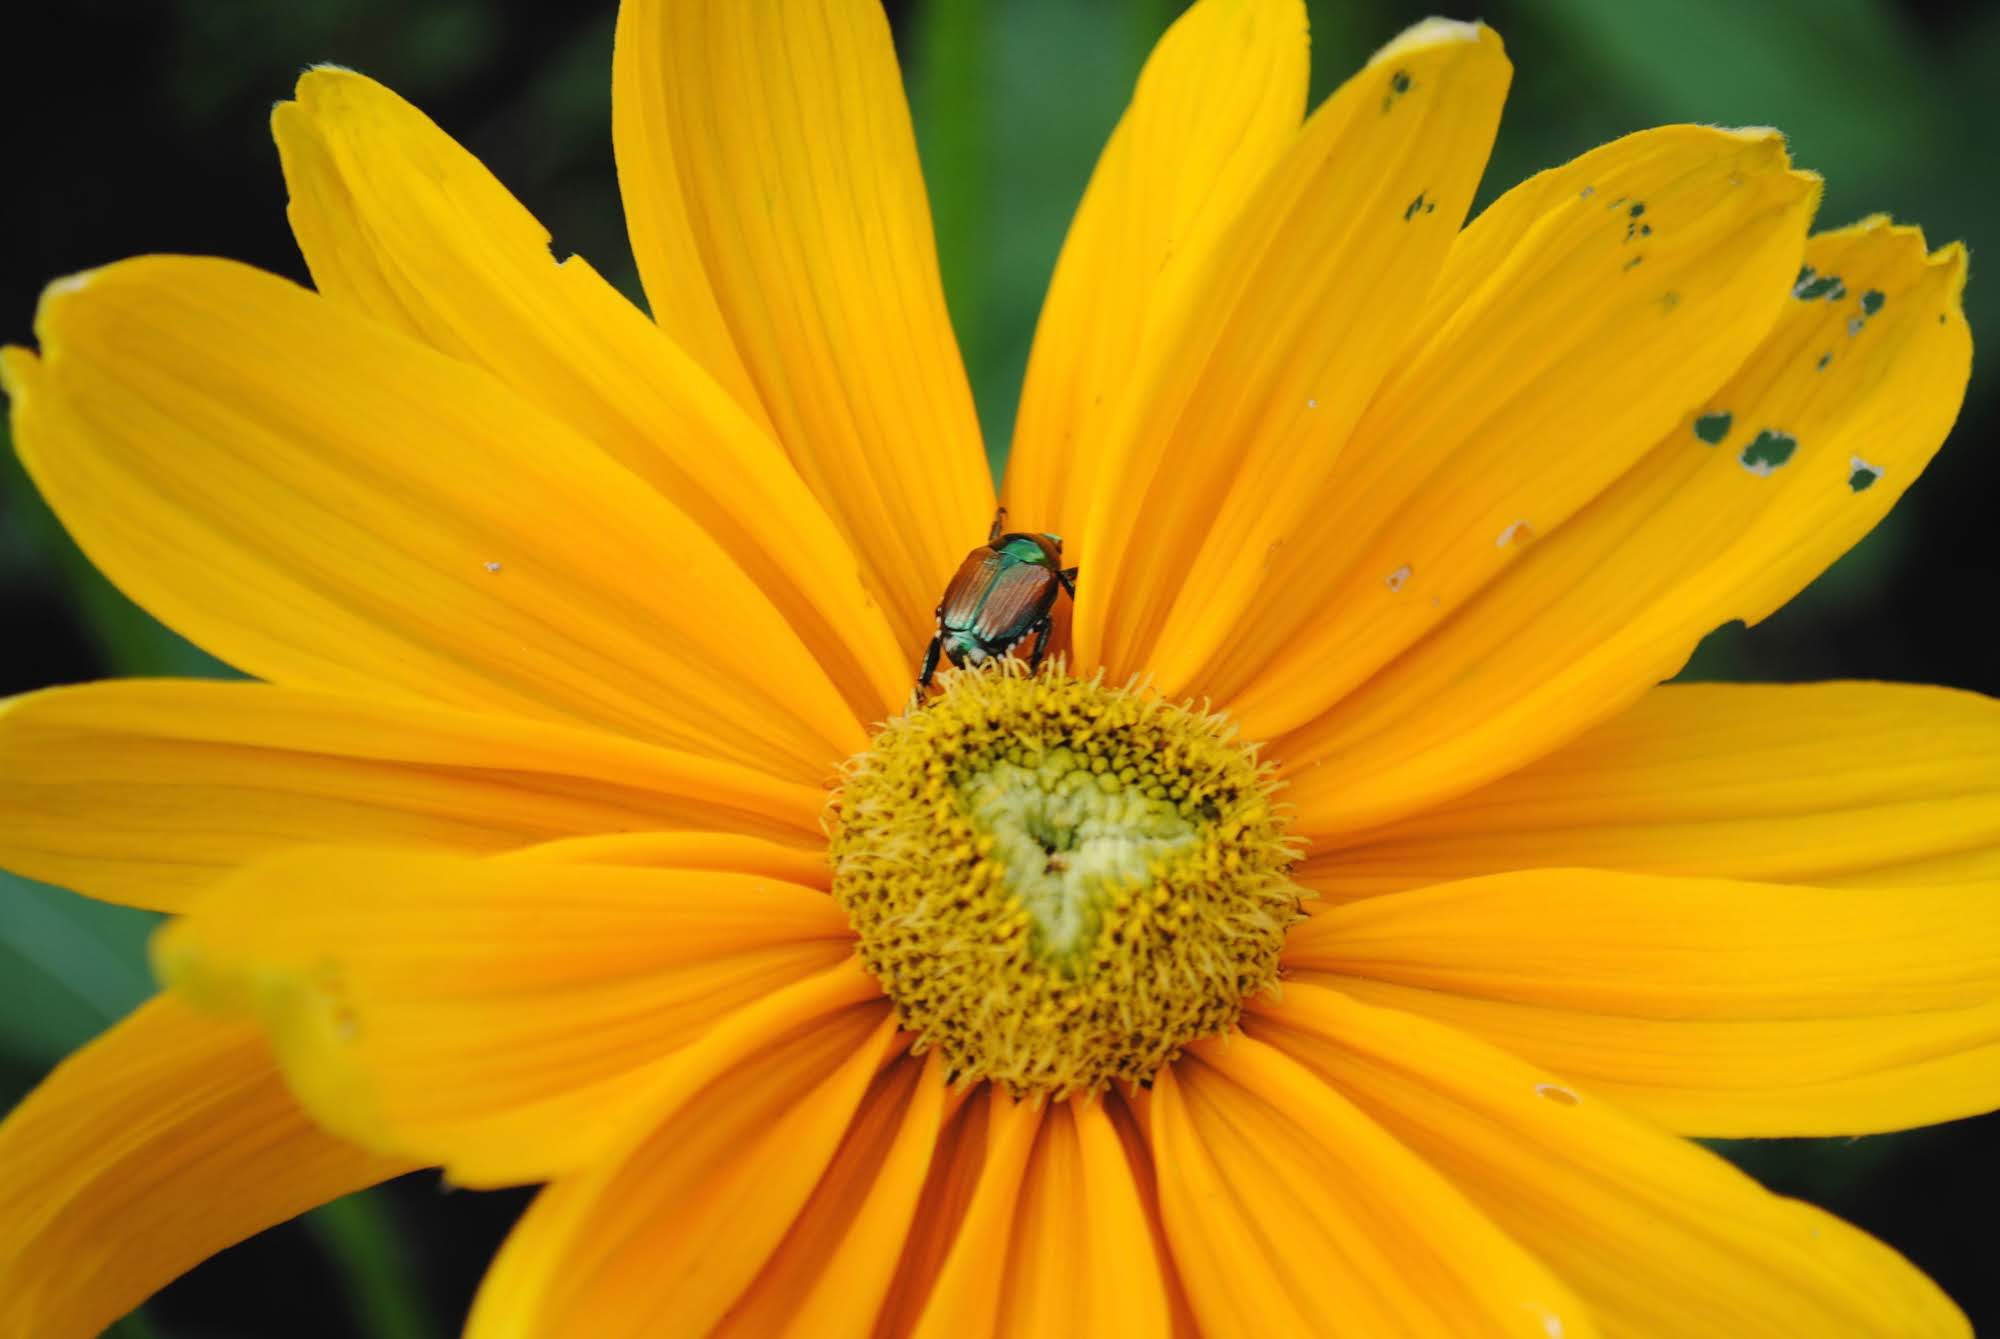
Even a small amount of urbanisation, industry and development can have an impact on waterways. Land use is the term we use to talk about what is on a certain portion of land, such as cities and agriculture compared to forests, wetlands, or waterbodies. Developing land use maps with appropriate resolution can answer a number of questions about what might be happening at a local level in a watershed. It also helps us track how land use changes over time, and what impacts that has on rivers and streams. Right now, land use data is only available at a 30m resolution. That means the smallest details are only available as 30 by 30 metre squares, leaving a lot of information out of the maps and excluding it from analysis. To help show this, consider the resolution of the following photo.
![]()
At this low resolution, we still get enough information to know that we are looking at a photo of a yellow flower. But without increasing the resolution of the image, we don’t have enough information to see that there is also a beetle on that flower.
In the case of a land use map, not having high enough resolution could mean that, for example, a small stream gets missed. And that stream might be really important to understand the local ecology! This is why we are developing higher resolution land use maps.
CSOs
Combined sewer overflows (CSOs) only happen in urban centres with sewer infrastructure that was built a long time ago, before there were alternatives to letting sewage flow into freshwater. These are problems left to us because of previous planning decisions, and can be difficult to change now that we have solutions for treating waste. Combined sewer overflows mean that untreated wastewater and stormwater go directly into waterbodies. This water typically contains untreated human sewage, industrial wastes, toxic substances and debris from sanitary sewage and street rubbish. The consequences of combined sewer overflows can include dangers to human health, especially when beach users, swimmers, or other people enjoying the river are exposed to contaminated water. Aquatic life can also be affected by combined sewage. For example, oxygen is used up during decomposition of the raw sewage, which means there is less oxygen available for fish and other lifeforms to breathe.
Road Salt
With urbanisation comes more paved surfaces. For humans’ safety, these streets, sidewalks, driveways and parking lots all need to be cleared of snow and ice in the winter. A go to de-icer used by municipalities, businesses, and individuals is salt (usually sodium chloride). While salt helps keep us safe on slippery winter roads, using too much salt can have serious consequences for urban waterways. High concentrations of salt (specifically chloride) can have immediate negative impacts on the survival and growth of many aquatic species. There are no biological processes that can remove chloride from water, and high concentrations of chloride in freshwater ecosystems can have long term effects on ecosystem health. Understanding when and how little road salt should be used to effectively manage ice and slippery conditions can help you reduce your impact on urban streams and their inhabitants.
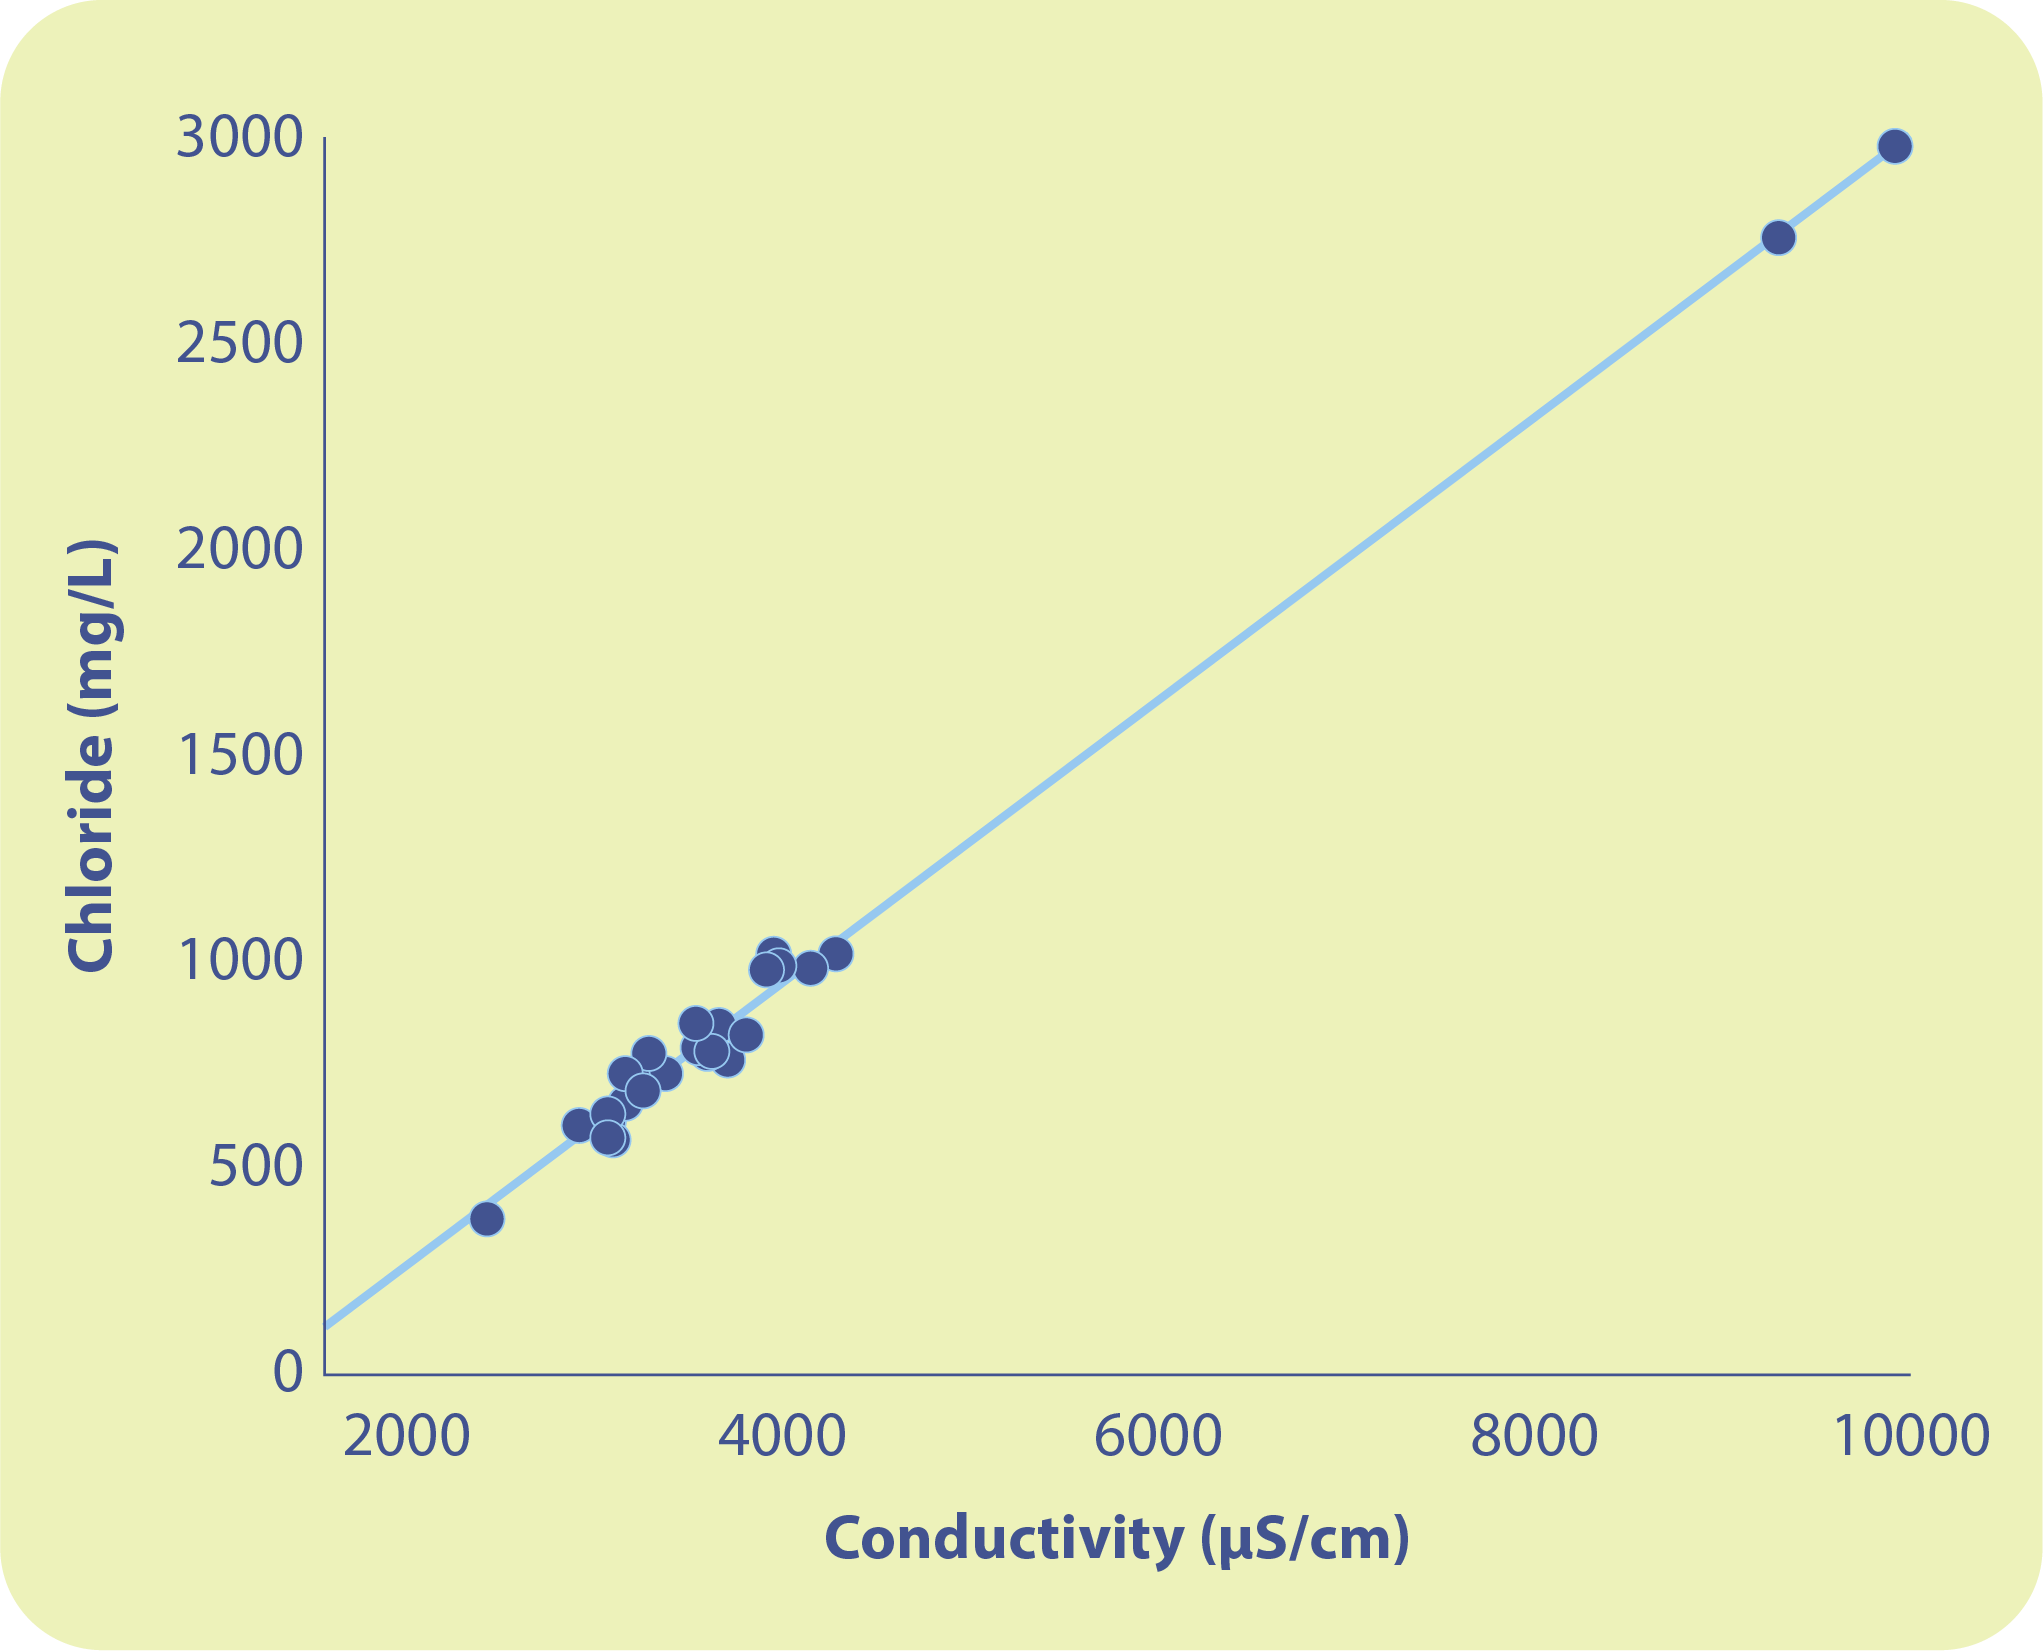
Relationship between conductivity and chloride concentration
Conductivity is the measure of how well water can carry an electrical charge and is directly related to the concentration of dissolved ions. There are many factors that can increase the conductivity in a river: runoff from the surrounding land, erosion of banks, an influx of groundwater, or pollution. When road salt (sodium chloride; NaCl) dissolves in water, it breaks down into positively charged sodium ions (Na+) and negatively charged chloride ions (Cl-). As more road salts dissolve into the water the concentration of ions goes up, increasing the water’s conductivity. Given the strong linear relationship depicted in this graph, and the relative ease of measuring it compared to chloride, Ottawa Riverkeeper has documented how conductivity can be used as a proxy for chloride concentrations.
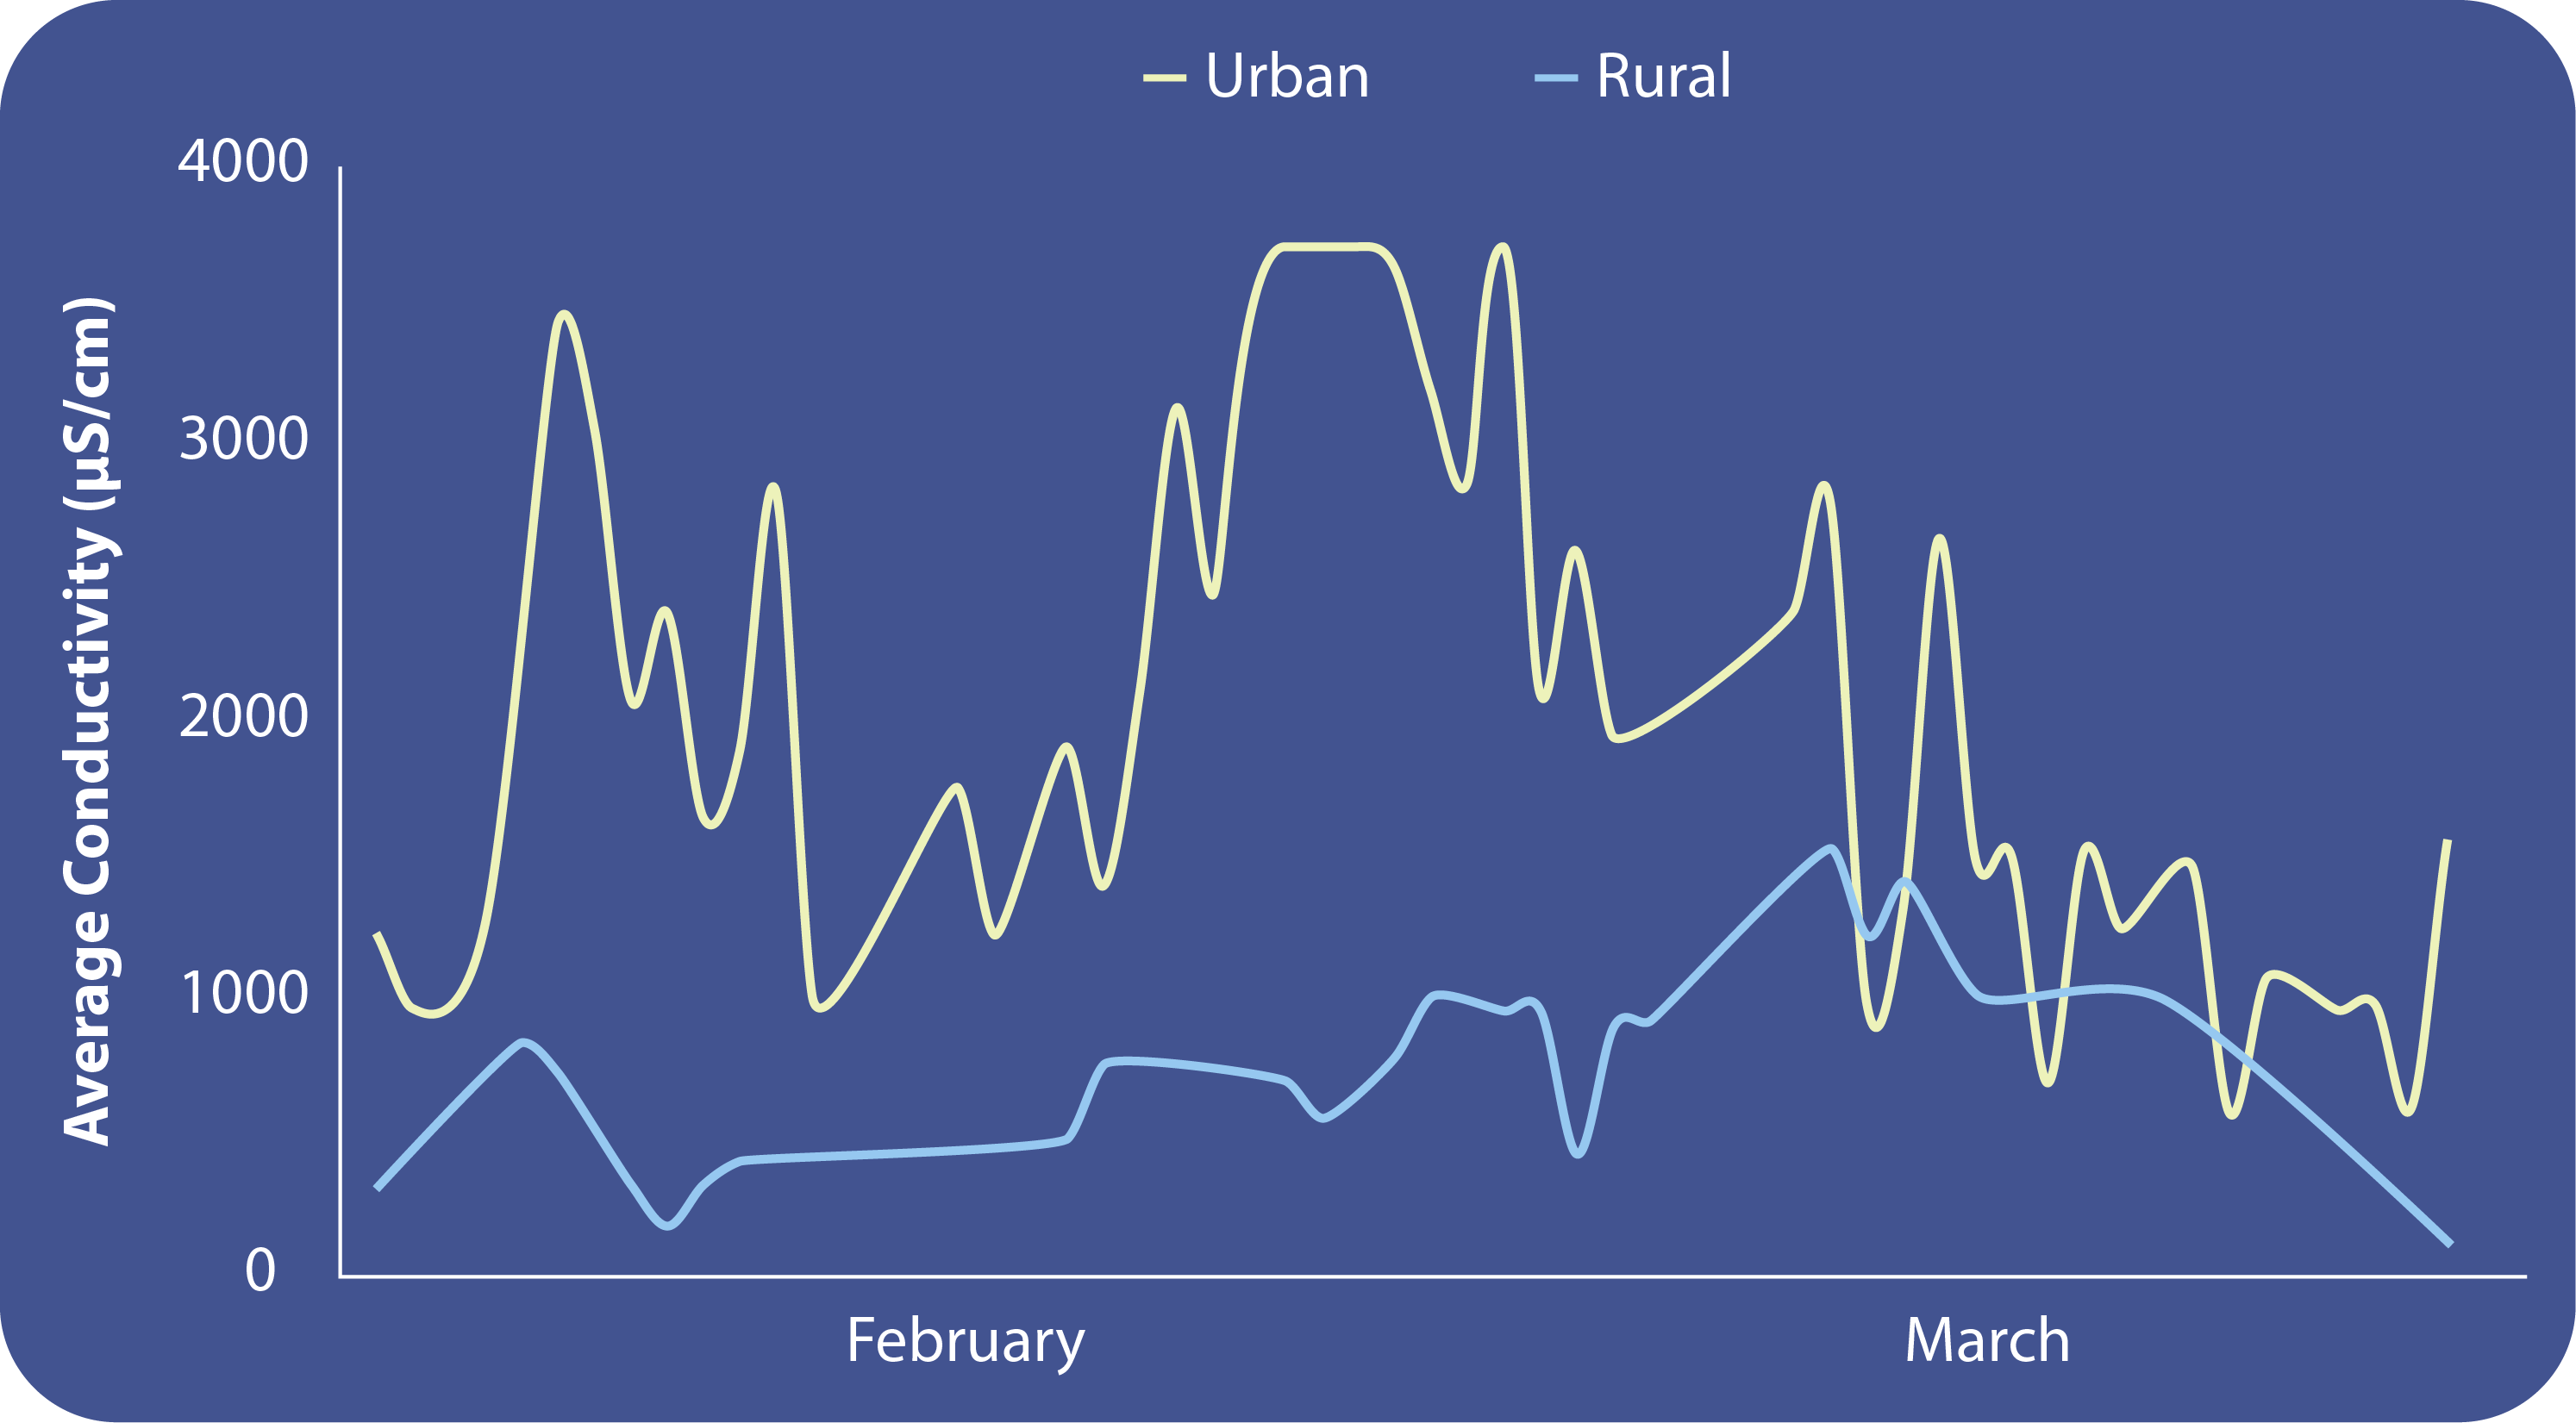
urban vs rural
Average conductivity measurements in Urban (green) and Rural (blue) streams after trigger events (events that would cause road salt to be used, or for significant melting to occur).
Road salt is used more in urban areas than in rural areas, where there are fewer roads and paved surfaces. In fact, our volunteer road salt monitors rarely measured conductivity levels high enough to reach the sampling threshold. That means that during winter months, conductivity in rural creeks was consistently low enough that it was unnecessary to verify the chloride concentration. At urban locations, on the other hand, volunteers frequently measured conductivity levels that were above the sampling threshold. Follow-up chloride measurements confirmed how much dissolved road salt was in these urban streams.The difference between urban and rural streams only reinforced what we already suspected, that road salt’s impact on our watershed is primarily a result of urbanisation.
You can help!
Additional resources:
Related indicators of watershed health
Visit the Ottawa Riverkeeper Data Portal